Observability
HoraeDB is observable with Prometheus and Grafana.
Prometheus
Prometheus is a systems and service monitoring system.
Configuration
Save the following configuration into the prometheus.yml file. For example, in the tmp directory, /tmp/prometheus.yml.
Two HoraeDB http service are started on localhost:5440 and localhost:5441.
global:
  scrape_interval: 30s
scrape_configs:
  - job_name: horaedb-server
    static_configs:
      - targets: [your_ip:5440, your_ip:5441]
        labels:
          env: horaedbcluster
See details about configuration here.
Run
You can use docker to start Prometheus. The docker image information is here.
docker run \
    -d --name=prometheus \
    -p 9090:9090 \
    -v /tmp/prometheus.yml:/etc/prometheus/prometheus.yml \
    prom/prometheus:v2.41.0
For more detailed installation methods, refer to here.
Grafana
Grafana is an open and composable observability and data visualization platform.
Run
You can use docker to start grafana. The docker image information is here.
docker run -d --name=grafana -p 3000:3000 grafana/grafana:9.3.6
Default admin user credentials are admin/admin.
Grafana is available on http://127.0.0.1:3000.
For more detailed installation methods, refer to here.
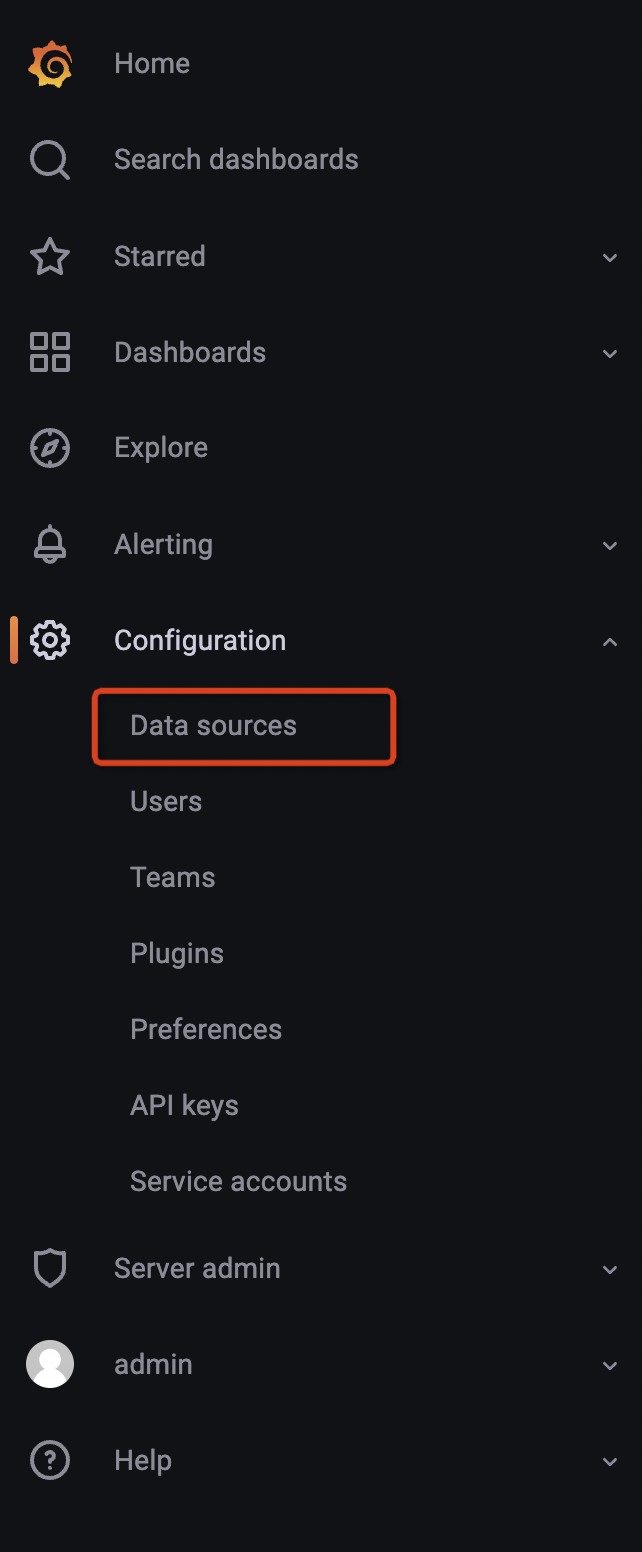
Configure data source
- Hover the cursor over the Configuration (gear) icon.
- Select Data Sources.
- Select the Prometheus data source.
Note: The url of Prometheus is http://your_ip:9090.
See more details here.
Import grafana dashboard
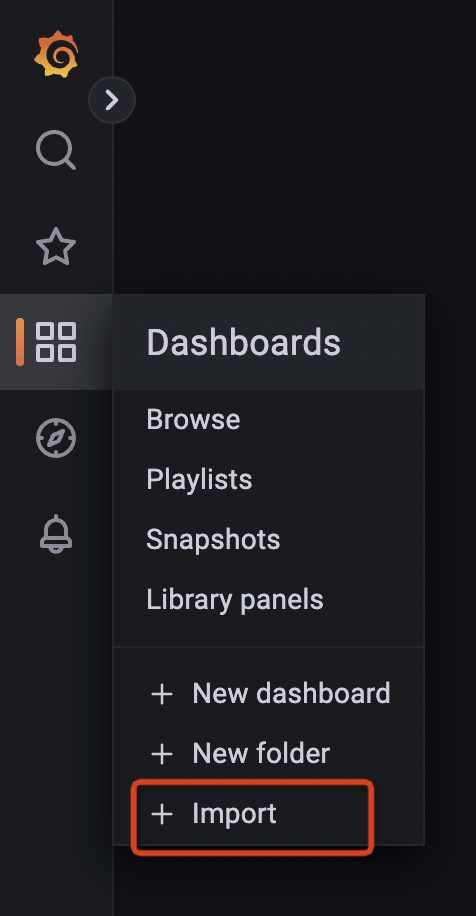
HoraeDB Metrics
After importing the dashboard, you will see the following page:
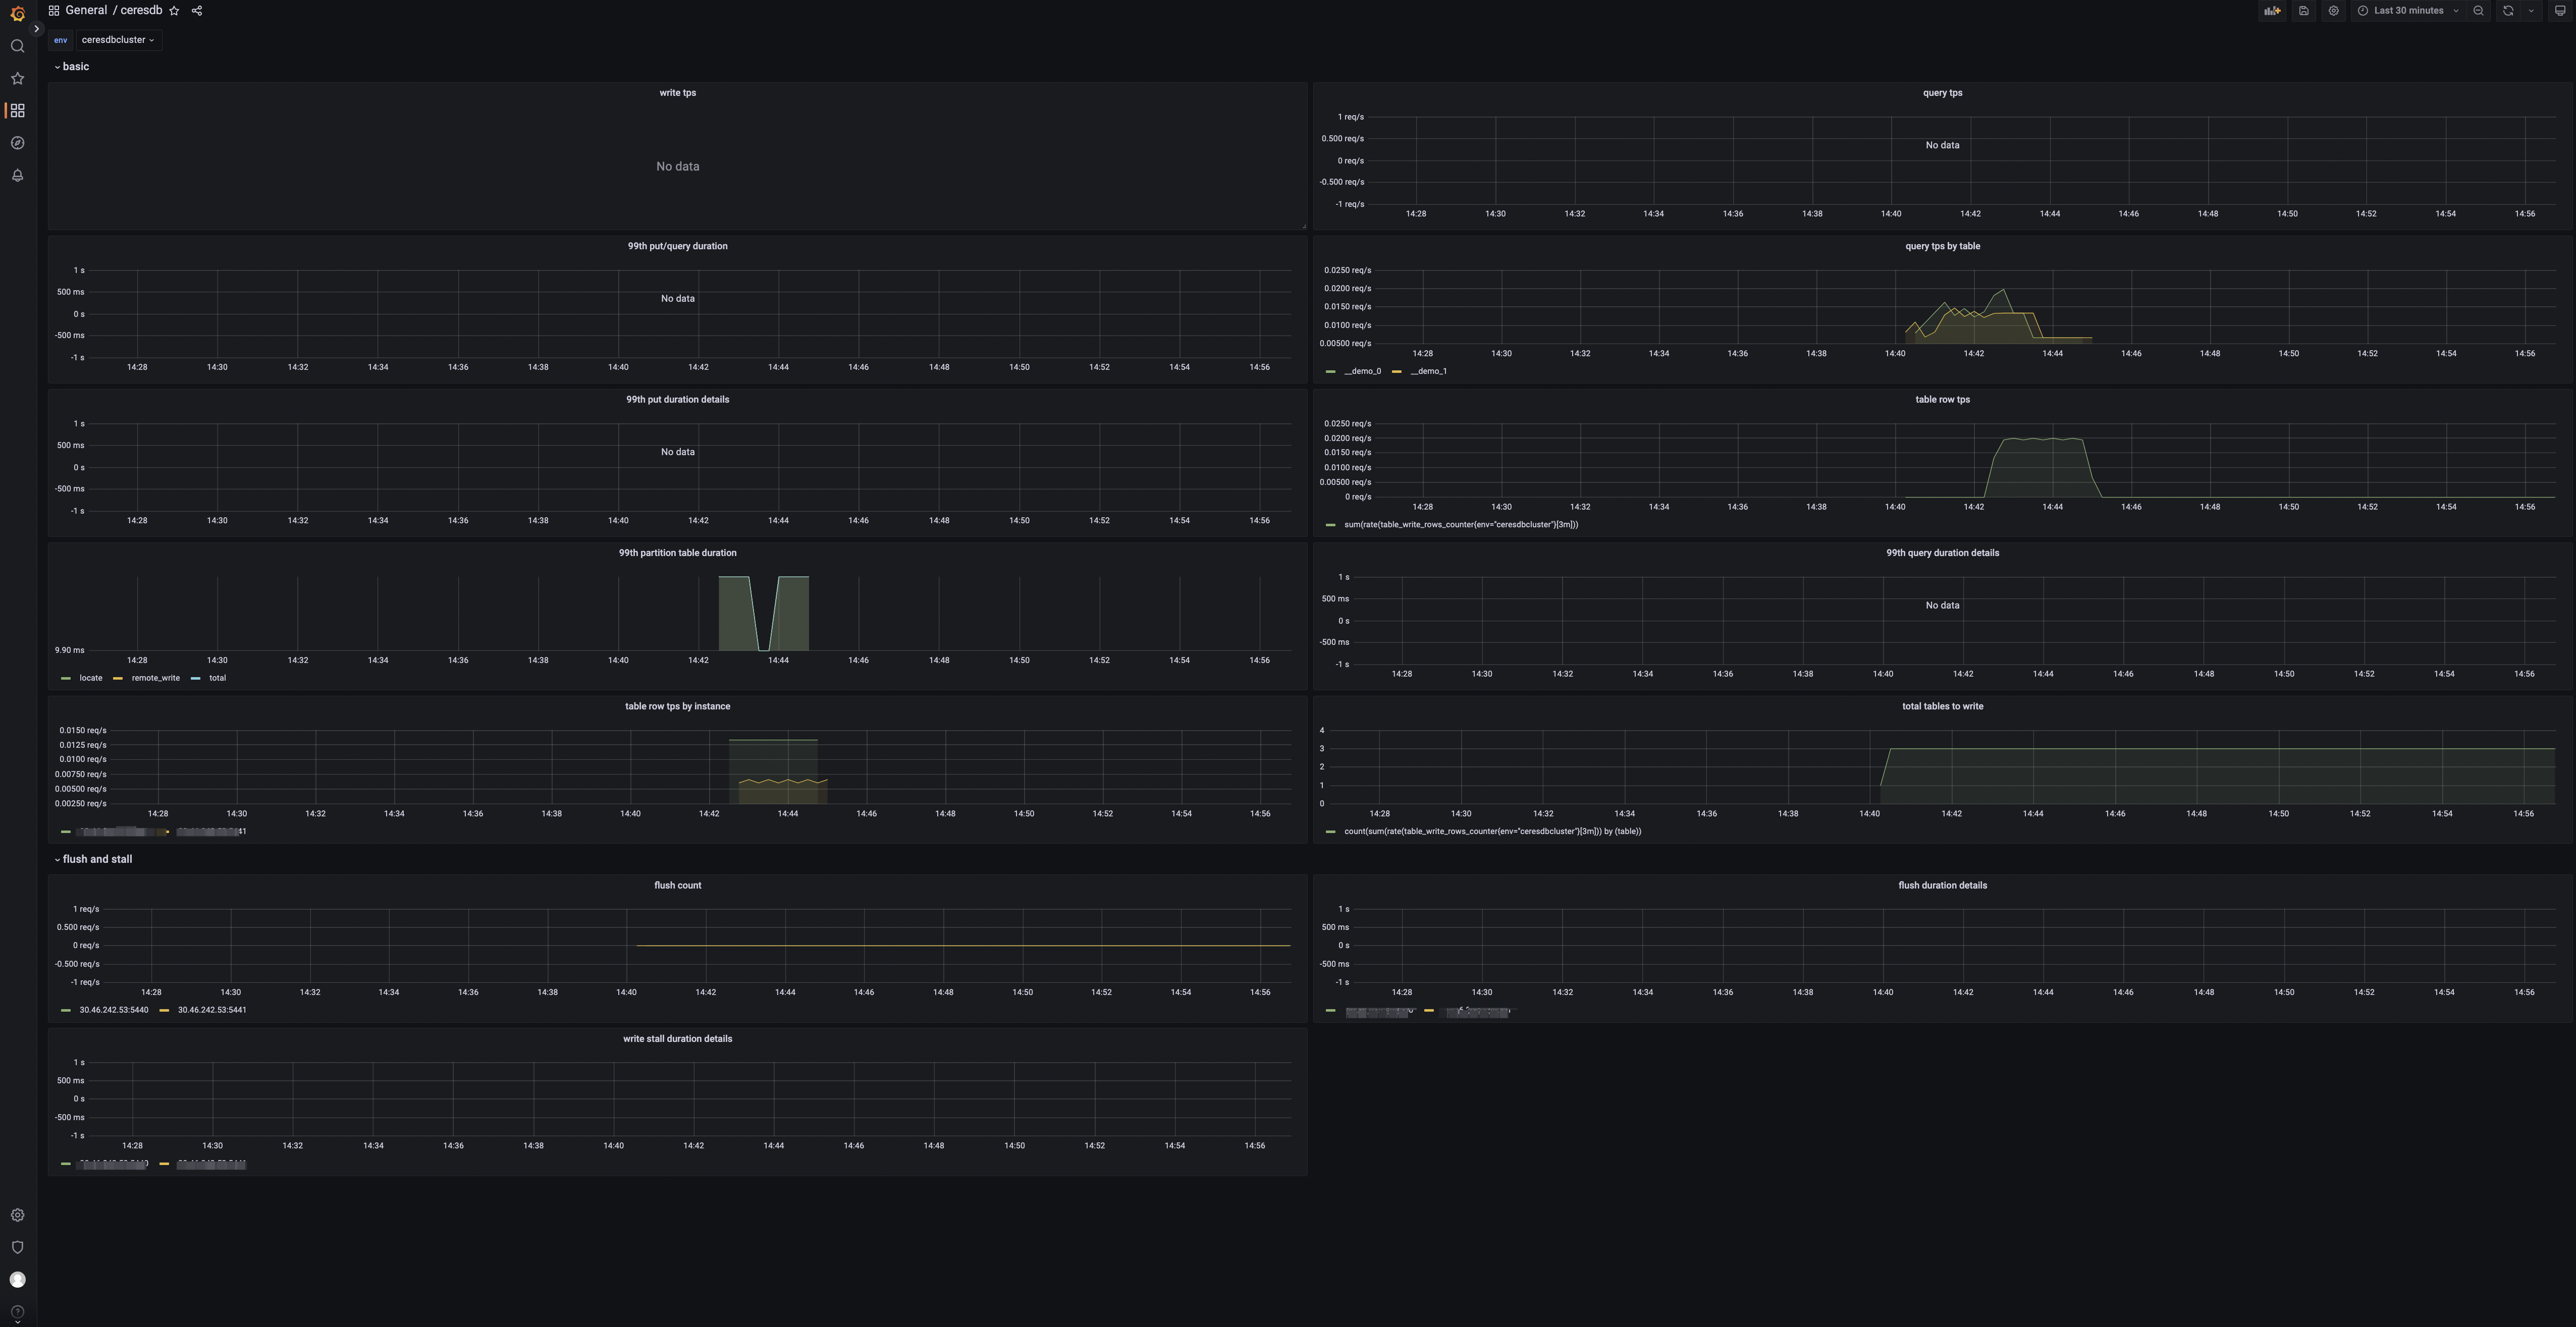
Panels
- tps: Number of cluster write requests.
- qps: Number of cluster query requests.
- 99th query/write duration: 99th quantile of write and query duration.
- table query: Query group by table.
- 99th write duration details by instance: 99th quantile of write duration group by instance.
- 99th query duration details by instance: 99th quantile of query duration group by instance.
- 99th write partition table duration: 99th quantile of write duration of partition table.
- table rows: The rows of data written.
- table rows by instance: The written rows by instance.
- total tables to write: Number of tables with data written.
- flush count: Number of HoraeDB flush.
- 99th flush duration details by instance: 99th quantile of flush duration group by instance.
- 99th write stall duration details by instance: 99th quantile of write stall duration group by instance.